TUTTEE ACADEMY LOGO
broken image
  • Home
  • About Us
  • Subjects 
    • CHEMISTRY
    • BIOLOGY
    • PHYSICS
    • MATHEMATICS
    • PSYCHOLOGY
    • ECONOMICS
    • BUSINESS
    • COMPUTER SCIENCE
    • CHINESE
    • ENGLISH
    • SPANISH
    • IBDP IA / EE
    • IBDP TOK
    • ONLINE TUTORIAL
  • Exam Boards 
    • IBDP
    • IBMYP
    • IGCSE & GCSE
    • HKDSE
    • GCE A-LEVELS
  • Courses 
    • IBDP Tuition
    • GCE A-Level Tuition
    • IBMYP Tuition
    • I/GCSE Tuition
    • HKDSE Tuition
  • Admission Test Prep 
    • PREDICTED GRADE
    • SAT / SSAT
    • UKISET (UK)
    • BMAT
    • UKCAT / UCAT
    • LNAT
    • TMUA (Cambridge)
  • Student Results 
    • IBDP STUDENT RESULTS
    • IGCSE & GCSE MATHEMATICS
    • A-LEVEL STUDENT RESULTS
    • IGCSE STUDENT RESULTS
    • GCSE STUDENT RESULTS (UK)
    • HKDSE STUDENT RESULTS
    • OUR STORIES
  • Question Bank
  • Resources
SCHEDULE A LESSON NOW

AS/A-Level Mathematics - Scaling & Covariance

Scaling & Covariance

· A-Level Maths,scaling,linear correlation,linear regression,covariance

Let's learn about scaling and covariance in linear regression of A-Level Maths!

Scaling 

If one or more variables is scaled using a linear transformation then the new regression equation (in relation to the old one) can be found by substituting the transformation into the original equation. 

For example, lets say that a regression line is given by:         y = 26.2x - 344  

Let’s say the explanatory variable is temperature in Celsius. We want the regression line in terms of Fahrenheit. To do this, we must substitute the formula for Fahrenheit into the original regression equation.  

The formula to convert Celsius (x) into Fahrenheit (t) can be found by the below equation: 

t = 9/5 x + 32

We need to rearrange this in terms of x.

x = (t - 32) 5/9

Substituting this into the regression line of y = 26.2x - 344   gives:

y =14.6t - 809.8

This formula is now in terms of Fahrenheit.  This formula can still be used for extrapolation and interpolation.  

Covariance 

Covariance measures the extent to which the values of x and y are associated, high with high and low with low. It is given by the formula:

broken image

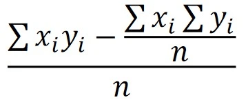
Covariance is denoted by the expression:

broken image

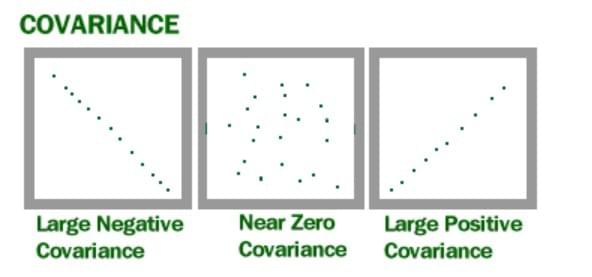
When a set of data follows a generally positive gradient, the covariance is positive. The two variables are said to be positively correlated. 

When a set of data follows a generally negative gradient, the covariance is negative. The two variables are said to be negatively correlated.  

When a set of data follows no clear gradient, the covariance tends to be around 0. It is said that there is no correlation.

broken image

CLICK HERE TO LEARN MORE ABOUT OUR A-LEVEL MATHS COURSES

SIGN UP FOR OUR A-LEVEL MATHS TRIAL NOW

Drafted by Eunice (Maths)

Reference

https://www.statisticshowto.com/probability-and-statistics/statistics-definitions/covariance/

Subscribe
Previous
AS/A-Level Mathematics - Reliability of estimation of...
Next
AS/A-Level Mathematics - Correlation
 Return to site
Profile picture
Cancel
Cookie Use
We use cookies to improve browsing experience, security, and data collection. By accepting, you agree to the use of cookies for advertising and analytics. You can change your cookie settings at any time. Learn More
Accept all
Settings
Decline All
Cookie Settings
Necessary Cookies
These cookies enable core functionality such as security, network management, and accessibility. These cookies can’t be switched off.
Analytics Cookies
These cookies help us better understand how visitors interact with our website and help us discover errors.
Preferences Cookies
These cookies allow the website to remember choices you've made to provide enhanced functionality and personalization.
Save