Let's learn about extrapolation, interpolation and residuals in A-Level Maths!
Linear Regression and Estimation
A travelling salesman wants to be able to predict his journey time to clients from the distance he travels. He records the distances he travels to 11 clients and his journey times:

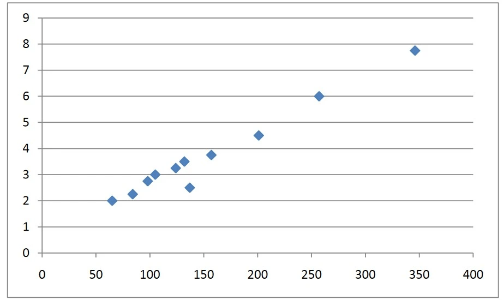
The distance is the explanatory variable, whilst the time is the response variable. It is very important to use a scatter diagram to check that a linear model is suitable, and not some other model.

As the diagram shows, it follows a generally close linear relationship.
The least squares regression line is given as:
y = 0.568 + 0.0205 x
There is always some significance to the value of a and b. In this case, the value of a is significant because it shows that there is a fixed time for a deliver of about 30 minutes. The value of b is significant because it expresses the average time to travel a mile.
Using the least squares regression line, we can now predict values of x which we don’t have in the original data.
Let’s predict the journey time when the distance, x, =180, 50 and 420.
x = 180, y = 0.568 + 0.0205 (180) = 4.258
x = 50, y = 0.568 + 0.0205 (50) = 1.593
x = 420, y = 0.568 + 0.0205 (420) = 9.178
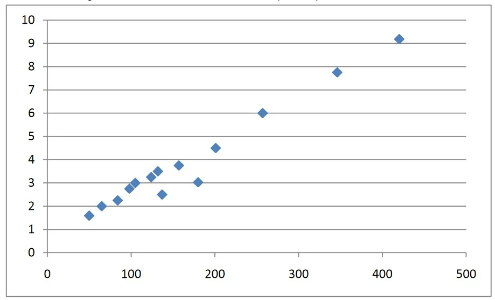
By plotting these predicted values on the same scatter diagram, we can comment on the reliability of these estimates.

x=50 can be considered a reliable estimate because it was calculated using interpolation, so the linear model can be better applied to predictions.
However, x=180 and x=420 may not be considered very reliable because they were calculated using extrapolation, and, as a result, are out of the data range and may not follow a linear relationship.
Residuals
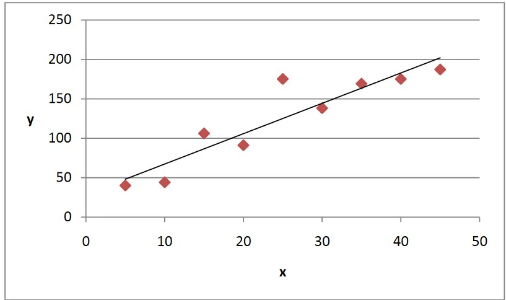
Presented below is a Bivariate data table and its plotted scatter diagram, with the least squares regression line given by
y = 3.58x + 28.83


As you can plainly see, none of the actual points lie on the least squares regression line.
If we were to predict the value of x=5 using the least squares regression line, we would get a value of y at 48.08. The table shows that the value of x=5 is 40. The differences between the observed values of x (the ones in the table) and those predicted by the least squares regression line are called the residuals.
The residual in the case of x=5 will be -8.8. Generally, if you find the average value of the residual, the higher this mean value, the less the data fits a linear model.
If the residuals tend to be generally positive, it means the observed values of x overperform the estimates of x. If the residuals tend to be generally negative, it means the observed values of x underperform the estimates of x. In general:
🔖Residuals can be used to determine a result which overperforms or underperforms
🔖Residuals can be used to determine relative outliers
🔖Residuals can be used to determine whether or not the data fits a linear model
Drafted by Eunice (Maths)

