TUTTEE ACADEMY LOGO
broken image
  • Home
  • About Us
  • Subjects 
    • CHEMISTRY
    • BIOLOGY
    • PHYSICS
    • MATHEMATICS
    • PSYCHOLOGY
    • ECONOMICS
    • BUSINESS
    • COMPUTER SCIENCE
    • CHINESE
    • ENGLISH
    • SPANISH
    • IBDP IA / EE
    • IBDP TOK
    • ONLINE TUTORIAL
  • Exam Boards 
    • IBDP
    • IBMYP
    • IGCSE & GCSE
    • HKDSE
    • GCE A-LEVELS
  • Courses 
    • IBDP Tuition
    • GCE A-Level Tuition
    • IBMYP Tuition
    • I/GCSE Tuition
    • HKDSE Tuition
  • Admission Test Prep 
    • PREDICTED GRADE
    • SAT / SSAT
    • UKISET (UK)
    • BMAT
    • UKCAT / UCAT
    • LNAT
    • TMUA (Cambridge)
  • Student Results 
    • IBDP STUDENT RESULTS
    • IGCSE & GCSE MATHEMATICS
    • A-LEVEL STUDENT RESULTS
    • IGCSE STUDENT RESULTS
    • GCSE STUDENT RESULTS (UK)
    • HKDSE STUDENT RESULTS
    • OUR STORIES
  • Question Bank
  • Resources
SCHEDULE A LESSON NOW

AS/A-Level Mathematics - Questions on Bivariate data

Questions on Bivariate data

· A-Level Maths,bivariate data,handling data,question analysis,best-fit line

Let's look at examples of bivariate data to learn more about this topic in A-Level Maths!

So, let’s calculate the least squares regression line for the following Bivariate data: 

broken image

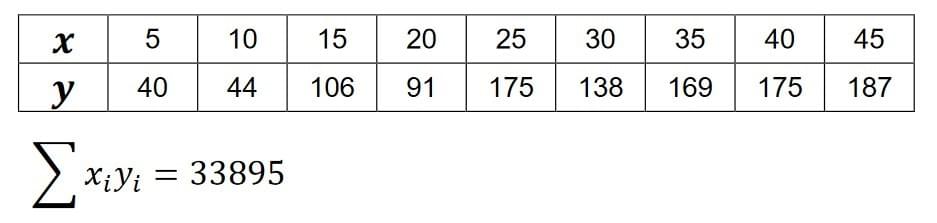
Important Note: The above sum is calculated by multiplying the data pairs, so (5 X 40)+(10 X 44) etc. 

broken image

b = (33895 - 9 x 25 x 125) / (7125 - 9 x 252) 

= 3.85

So the gradient is 3.85. 

a= 125 - 3.85 x 25

=28.83

So the least squares regression line for the above Bivariate data is: 

y = 3.85x + 28.83

So what is the significance of this equation for the least squares regression line? 

The straight line shown on the diagram below is the plotted version of the equation: y = 3.85x + 28.83

broken image

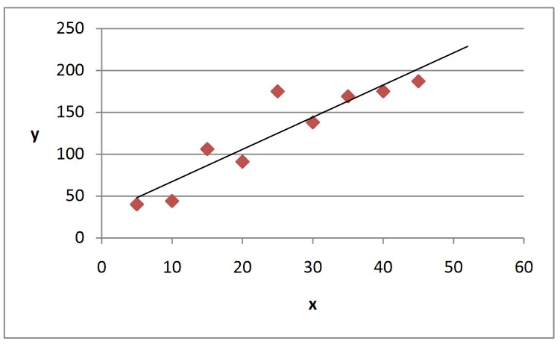
Fitting a straight line to a set of Bivariate data is called fitting a linear regression model. We can use the least squares regression line to predict values of x which are outside the range of the original data. 

For example, using the data shown to the left, if we want to predict the value of y which will be given by the value of x=50, we can substitute x=50 into the least squares regression line. 

y = 3.85 x 50 + 28.83 = 221.33

Predicting in these cases is called extrapolation. Values predicted by extrapolation must be treated with caution, by analysing the data so as to see whether predicting a value for x will have any implications, and whether or not it’s actually plausible!   

Predicting values within the range of the given data is called interpolation.  For both interpolation and extrapolation, if a linear line is an appropriate model for Bivariate data, then predicting values of y by substituting unknown values of x is usually reliable.

Linear Regression Example Question 

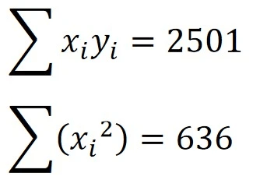
A y on x regression equation is to be calculated for two variables x and y. Given that: 
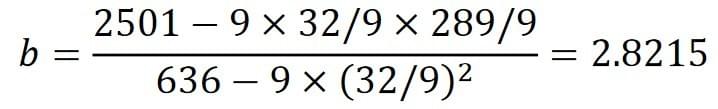
broken image

X̅   = 32/9

ȳ = 289/9

Calculate the least squares regression line: 

broken image

a = 289/9 - 2.8215 x 32/9 

= 22.08

So the least squares regression line is given by: 

y = 2.8215x + 22.08

CLICK HERE TO LEARN MORE ABOUT OUR A-LEVEL MATHS COURSES

SIGN UP FOR OUR A-LEVEL MATHS TRIAL NOW

Drafted by Eunice (Maths)

Subscribe
Previous
AS/A-Level Mathematics - Bivariate data
Next
A2/A-level Mathematics - Trigonometric Identities
 Return to site
Profile picture
Cancel
Cookie Use
We use cookies to improve browsing experience, security, and data collection. By accepting, you agree to the use of cookies for advertising and analytics. You can change your cookie settings at any time. Learn More
Accept all
Settings
Decline All
Cookie Settings
Necessary Cookies
These cookies enable core functionality such as security, network management, and accessibility. These cookies can’t be switched off.
Analytics Cookies
These cookies help us better understand how visitors interact with our website and help us discover errors.
Preferences Cookies
These cookies allow the website to remember choices you've made to provide enhanced functionality and personalization.
Save