

Let's learn about bivariate data and linear relationship in A-Level Maths!
Bivariate Data
Consider the below results table, for the variables x and y.
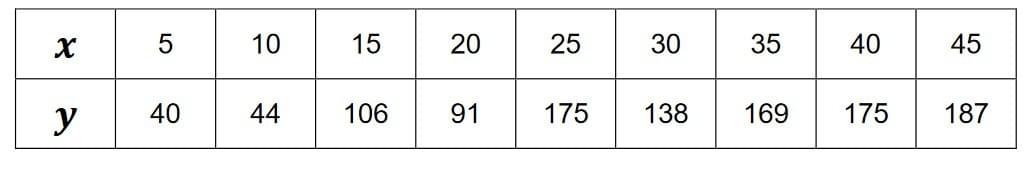
Data that consists of pairs of values of two random variables, like the above table, is called Bivariate data.
The explanatory variable is usually plotted as x, and, in the context of an experiment, is the variable that is changed. The response variable changes as a result, and is dependent on the explanatory variable.
Plotting the above data on a scatter graph is a good way of determining linear relationships.
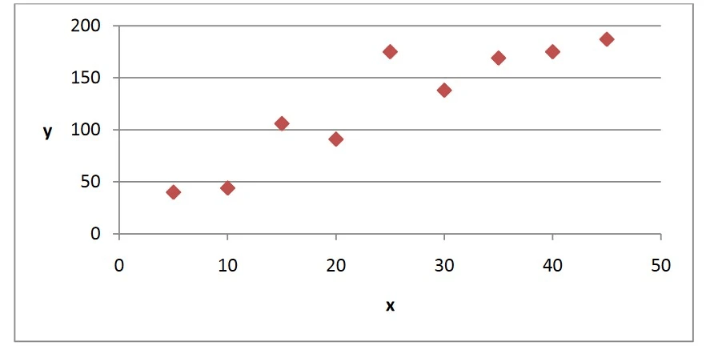
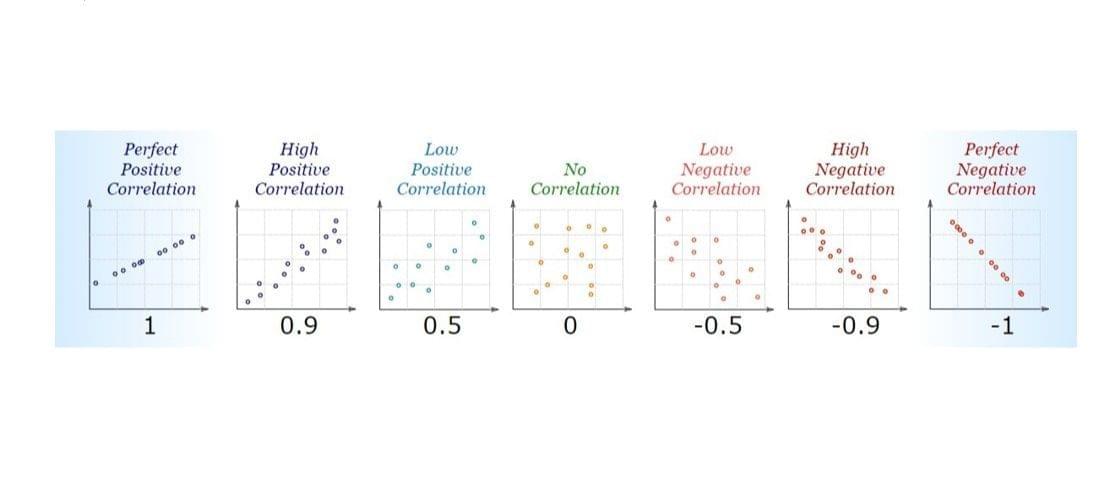
We would say that this data is positively correlated. Correlation is the focus later on in this segment.
Also, we could plot a line of best fit on this data so as to evaluate the linear trend.
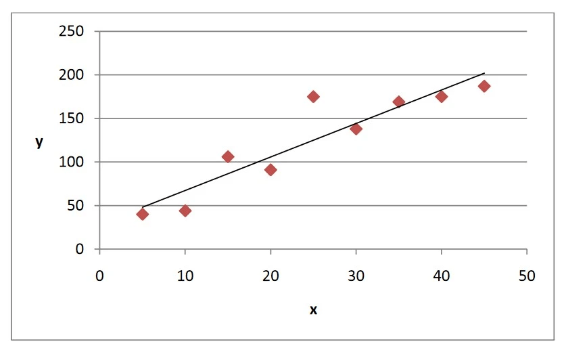
The above diagram shows the same data, but with a line of best fit. When working on paper, we would judge a line of best fit on eye, whilst a computer will use a mathematical method to calculate the perfect line of best fit based on the whole data set. This mathematical method will form the focus on linear regression in this chapter.
A line of best fit, called a least squares regression line in the Statistics world, will be a linear line. Linear lines have the following formula:
y = mx + c
The gradient, m, needs to be calculated, as well as the y-intercept, c.
If the data follows a negative relationship, then the gradient of the least squares regression line will be negative, and if the data follows a positive relationship, the gradient of the least squares regression line will be positive.
A linear regression line will always pass through the point ( x̄ , ȳ), the mean of the explanatory variable and the mean of the response variable.
The regression coefficient of y on x (the way to calculate the value of b, the gradient) is given by the expression:
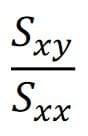
Which means the covariance of the Bivariate data divided by the variance of the explanatory variable. This is expressed in the below formula, for b:
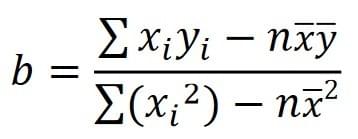
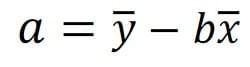
Where n is the number of data pairs, so, for example, in the table presented on the previous page, n would equal 9. To calculate the value of a, the y-intercept, we use the below formula:
Drafted by Eunice (Maths)
Reference
https://mathtec.weebly.com/bivariate-data-2020.html