In this topic of IBDP Mathematics, we will be discussing the different types of mathematical models - these include linear models, piecewise models and non-linear piecewise models.
Linear Models
In IBDP Mathematics, one type of mathematical models you need to know is the linear model. A linear model is when the two variables are linearly related (i.e. they can be represented with a straight line on a graph).
An example of two variables that would be linearly related would be the number of boxes of cookies bought and the amount of money spent at the supermarket (assuming you only buy boxes of cookies).

- Thinking about this intuitively, each box of cookies cost the same amount. So with every increase in box of cookies bought, you will have the same amount of increase in the money spent.
- e.g. Say a box of cookies costs $10. If you buy one box, you will spend $10. If you buy two boxes, you will spend an additional $10, therefore will spend a total of $20.
- As the amount of money spent increases by the same amount for each additional box you buy, it would form a linear relationship.
- If you plot the two variables on a graph, the graph would look a little bit like this:
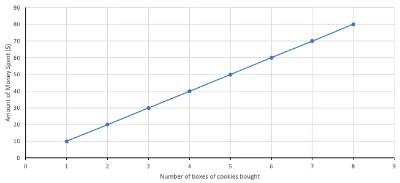
In the example above, the relationship between the number of boxes of cookies bought and the amount of money spent at the supermarket is exact. We know this because we can use the model above to find the exact amount of money spent depending on the number of boxes of cookies bought.
- An exact linear model is able to accurately represent the relationship between two variables, and all the data points lie directly on the line.
However, in many real world problems, the connection between the two variables are not exact (i.e. we cannot use the linear model to give an exact value). The variables may not strictly follow the linear model, and there are some deviations from the linear model. In these situations, plotting the data points would likely allow us to observe a linear trend, which means we are able to use a linear model to approximate the relationship between the two variables.
- An example of two variables that are not exactly linear, but follow a linear trend, would be age and height of female primary school children.
- Intuitively, there should be a constant increase in height as age increases in female children - this means that the data should follow a linear trend.
- However, some people may grow more in one year compared to another year - this means that there will be deviations from the linear model, and the model is only an approximation.
- If you plot these two variables on a graph, it would look like this:
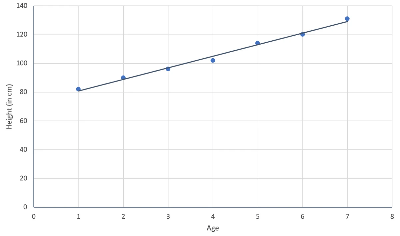
As you can see, the data point follows a linear trend, but the data points don't lie exactly on the model. The linear model only approximates the relationship between the two variables.
There are two ways one can use an approximate linear model to make predictions.
- If you use the model to predict a value within the range of the given data, then this is called interpolation.
- Values obtained by interpolation are typically valid predictions.
- If you use the model to predict a value outside of the range of the given data, then this is called extrapolation.
- One must be careful if extrapolating, as you are assuming that the relationship between the variables continues to be linear as you move outside the range of the data, but this is not often the case.
- It is not unlikely for the relationship between the variables to change outside the range of the data.
You will be expected to be able to construct linear models if given data. However, in IBDP Mathematics, since you will be allowed access to a graphing calculator during the exam, you will only need to type the data into your calculator, and have your calculator produce the linear model. If you would like more assistance with this, don't hesitate to reach out to our tutors! :)
Piecewise Models
Another type of models that you need to know in IBDP Mathematics is piecewise models. A piecewise model is a model that is made up of several different line segments.
- In real life, the relationship between two variables do not stay the same over all its possible values. It is likely that there are different relationships over different intervals.
- In order to more accurately represent the relationship, we can divide the range of possible values for the independent variable into smaller subintervals, and generate separate linear equation for each segment.
The graph of a piecewise model would look something like this:
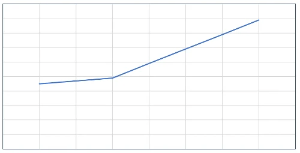
An example of a real life situation that would require a piecewise model would be the cost of electricity over a period of time.
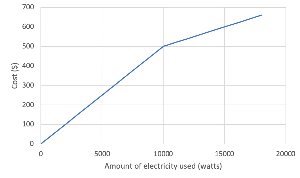
- Say that the initial cost of electricity (measured in watts) is $50 per 1000 watts. However, if you use over 10,000 watts within a month, the cost of electricity will decrease to $20 per 1000 watts.
- In this example, you can see that the cost of electricity has a different rate depending on the total amount of electricity used.
- One linear equation would not be an accurate representation of the cost of electricity. Therefore we should separate the independent variable into subintervals, and use different equations to represent the different intervals.
- For this example, it would be good to split the independent variable (i.e. the amount of electricity used in watts) into the intervals 0-10,000 watts, and >10,000 watts. This is because the change in rate occurs once one has used 10,000 watts.
- For values of electricity between 0 and 10,000, the cost of electricity is given by cost = 0.05 x Amount of electricity used (in watts)
- For values of electricity greater than 10,000, the cost of electricity is given by cost = 0.02 x Amount of electricity used (in watts)
- The graphing the model would look something like this:
Non-Linear Piecewise Models
The last type of model you need to know in IBDP Mathematics is non-linear piecewise models. These models are like piecewise models, but instead of line segments, you can have curves (i.e. non-linear functions for different segments).
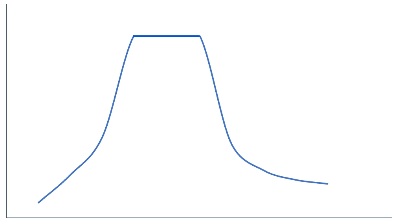
An example of a situation where you could use non-linear piecewise models would be if you were measuring the speed of a runner over distance.
- In this example, you could expect that the runner starts off slow, but gradually increases their speed - this could be represented using a function that curves upwards (like an increasing exponential function).
- However, once they reach a certain distance, their speed starts staying constant - this could be represented using a linear segment.
- Over longer distances, their speed could decrease rapidly, before slowing to a slower speed - this could be represented using a function that curves downards (like a decreasing exponential function).
- The model for this situation could look something like this:
With these types of models, you will be expected to be able to use these models to make predictions. With piecewise models (both linear and non-linear), you will either be given a graph to make an estimate, or you will be given a set of equations along with the domains of each equation.
- If you are given sets of equations for each segment, simply substitute the given value into the equation whose domains includes the given value.
- lIf you are given the graph, simply locate the point on the graph with the x-coordinate with your given value, and interpret the y-coordinate.
This is the end of this topic. Well done for making it to the end!


